Navigating MAVIS
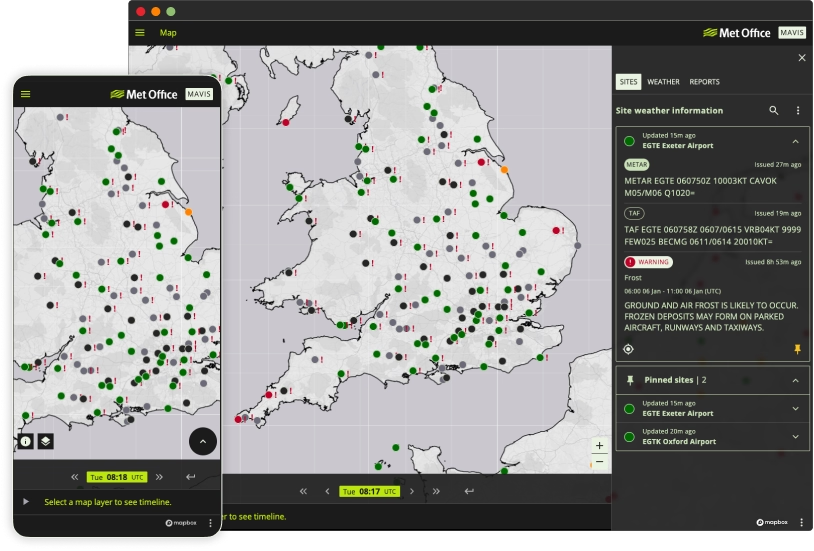
Once signed in to MAVIS you will be met with a view of the basemap with no map layers selected. Aerodromes will be visible on the map, and for sites actively producing meteorological data such as TAFs and METARs, the aerodrome will appear either green, amber, or red. You may also see a red exclamation mark (!) next to some aerodromes. This is present if a warning exists for this aerodrome.
Different user groups will have a different default set of aerodromes on the basemap. The image below may not represent your view when you first sign in to MAVIS.
Weather Layers
Weather layers can be accessed by navigating to the “WEATHER” tab in the drawer on the right-hand side of the map view.
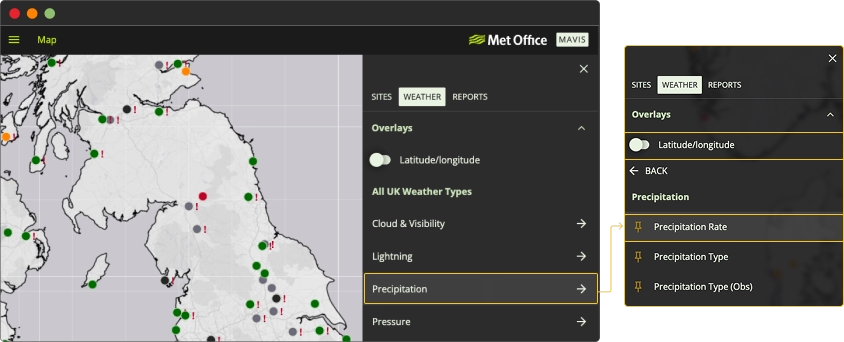
Once the weather tab is selected, you can select your desired category of map layer by clicking in the menu. This will reveal the individual map layers which, once selected, will be visualised on the map. Please note, only the map layers you are eligible to view, will be shown in the list.
It is also possible to toggle lines of latitude and longitude on and off in this menu.
Legend
When a weather map layer is selected, it is possible to view the legend by selecting the 'map key' toggle on the top right of the map, like so:
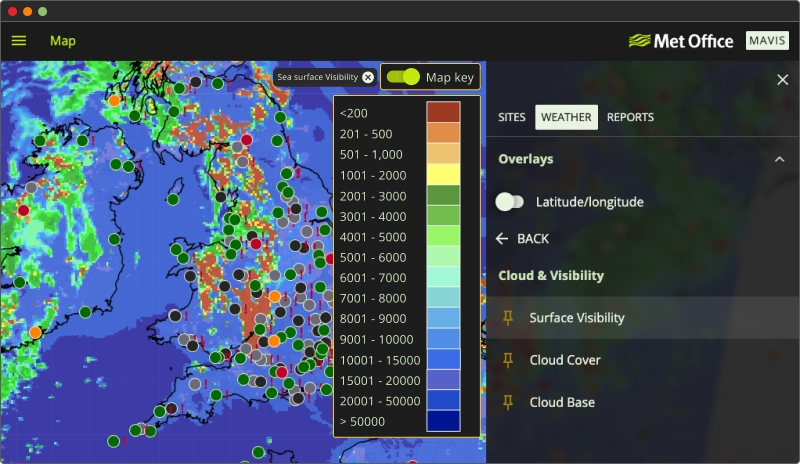
The legend will update as different map layers are selected and where more categories are present than visible in the legend, the legend itself can be scrolled to show the available data.
Charts and Reports
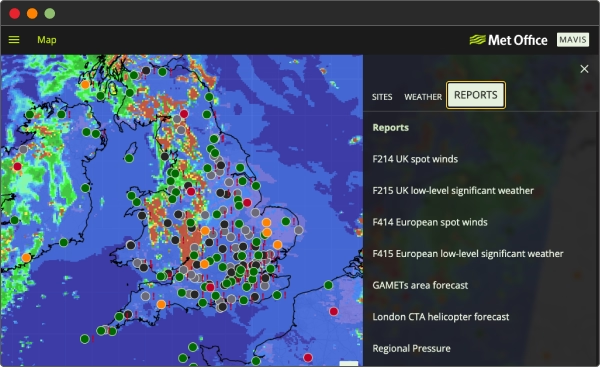
Charts and reports available to you can be found by navigating to the “REPORTS” tab in the menu on the right-hand side of the map view. When selected, the drop-down menu will appear revealing charts and reports specific to your access requirements. Therefore, the example below may not be representative of the reports you can see in MAVIS.
Site Information
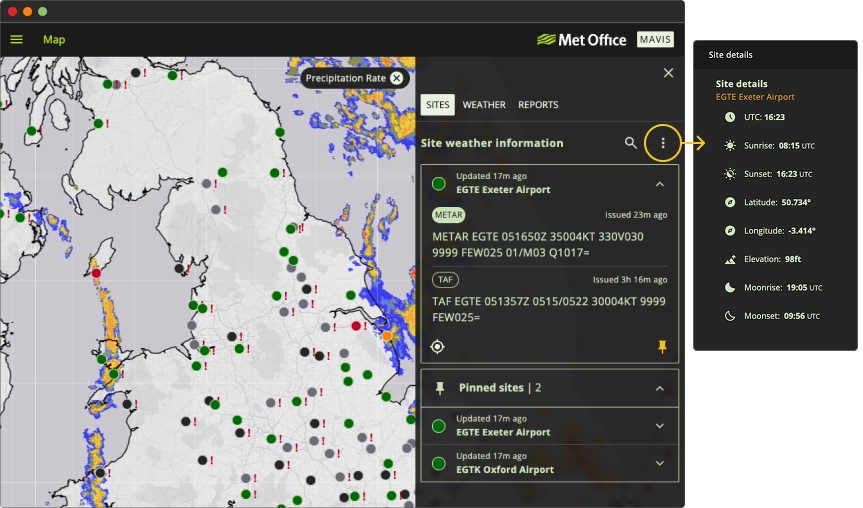
To view site specific information, including the most recently available TAFs, METARs, and warnings, select a site on the map with either a red, amber, or green colouration. Grey sites represent aerodromes in which meteorological data is not currently available, whilst black aerodromes represent aerodromes that do not produce meteorological data. To see more information about the site itself, such as latitude and longitude, click the three dots on the right side of the “Site weather information” header.