Description
The Aerodrome Table provides an hour-by-hour summary for the next 36 hours detailing current weather and forecasts specific to airports.
The table also displays RAG (Red/Amber/Green) to provide an at-a-glance snapshot of weather conditions.
Key Features & Properties
The table itself displays the following information:
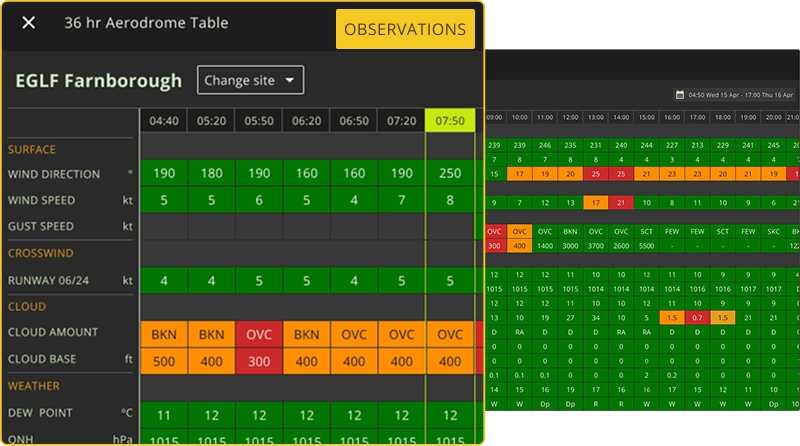
- The last seven METARs covering the previous three hours. These are displayed in the first seven columns and are known as the 'observation' columns. The observation columns are updated every thirty minutes at ten minutes to and twenty minutes past the hour (for example, 06:50 & 07:20 am). The last observation column is highlighted using a green outline.
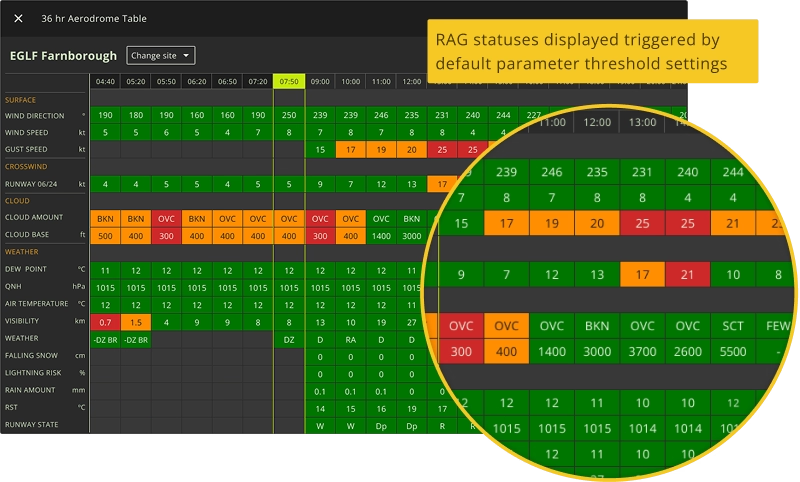
- Forecast conditions for the next 36 hours are displayed in each of the columns to the right of the last observation column. This consists of an hour-by-hour breakdown of the expected conditions displayed with a RAG status ( Red/Amber/Green). The RAG statuses displayed are triggered by default parameter threshold settings.
- Runway surface temperature and data from runway sensors is an optional add-on feature for customers.
The 36hr Aerodrome Table has the following properties, of which users should be aware:
-
The date and time of the 36hr Aerodrome Table is always displayed above the table to the right, for ease of reference.
-
Full width view is not available on desktop, tablet or mobile devices, but the table can be scrolled and moved around using a mouse to display any unseen data.
- To view weather data for a different airport, users can select the ‘change site’ button positioned above the table (on the left) to select another site from the dropdown list.
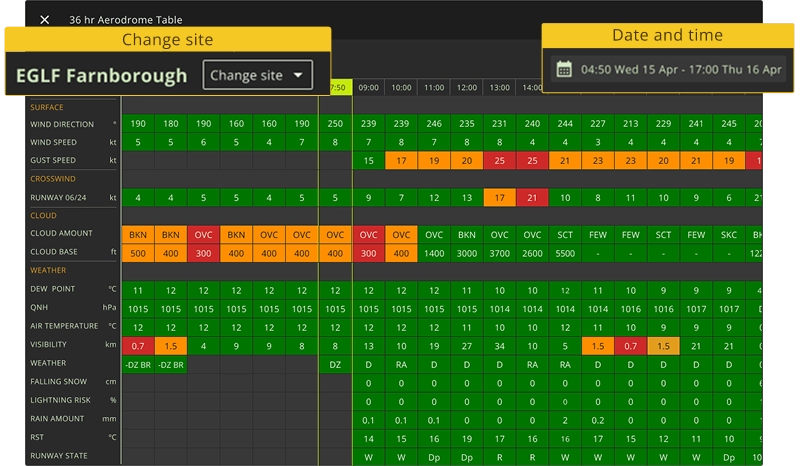
- Weather parameters are shown with corresponding units of measurement in the left-hand column.
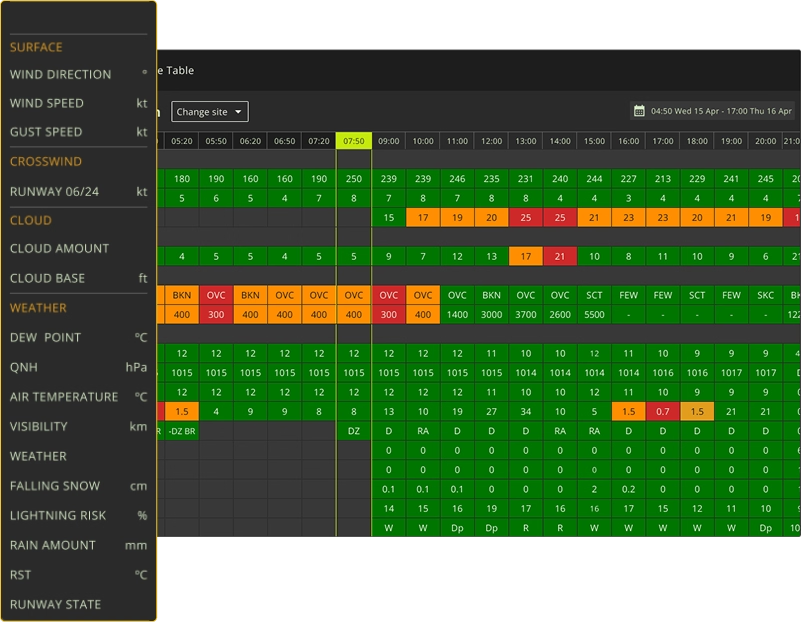
- The table is set to automatically refresh the data once every 1.5 minutes
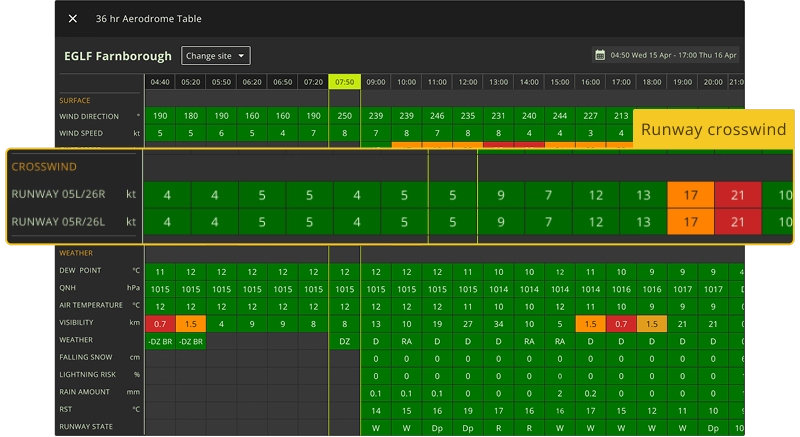
- For parameters that are specific to the runway, like crosswind for instance, the individual runways are listed in the left-hand column in the same section as the weather parameter.
- The weather parameters ‘Upper wind direction & Upper wind speed’ show data at 3000ft.
-
Falling snow is the snow component of the precipitation in the forecast period and should not be mistaken for ‘lying snow’, which is the depth of snow on the ground from previous snowfall that has not melted. ‘Falling snow’ may add to ‘lying snow’ but it may also not settle (i.e. melt) and therefore produce no additional lying snow accumulation.
-
The following codes apply to the weather parameter ‘Runway state’:
- Dry = D
- Damp = Dp
- Wet = W
- Wet & raining = R
- Frosty = F
- Lying snow = S
- Icy = I
- Unknown = blank
-
Note: The weather parameters ‘Rain amount’ and ‘Falling snow’ provide accumulative forecasts in the previous hour. This means that: A data point for 1200Z = the amount forecast to accumulate between 1100-1200Z.
RAG Statuses
The 36hr Aerodrome Table displays RAG statuses (Red/Amber/Green), for the following weather parameters:
- Surface Wind Direction
- Surface Wind Speed
- Surface Wind Gust
- Upper Wind Direction
- Upper Wind Speed
- Crosswind
- Air Temperature
- Cloud (amount & base)
- Rain Amount
- Lightning Risk
- QNH
- Visibility
- Falling Snow
- Weather
- RST (Runway Surface Temperature)
The RAG statuses displayed in the table are dependent on the default thresholds requested by each organisation. Eventually, MAVIS will allow admin users to customise their RAG thresholds.
Where there is no RAG status for a particular threshold, the table will display data with a BLACK background. These rows include Dew Point and Runway State.
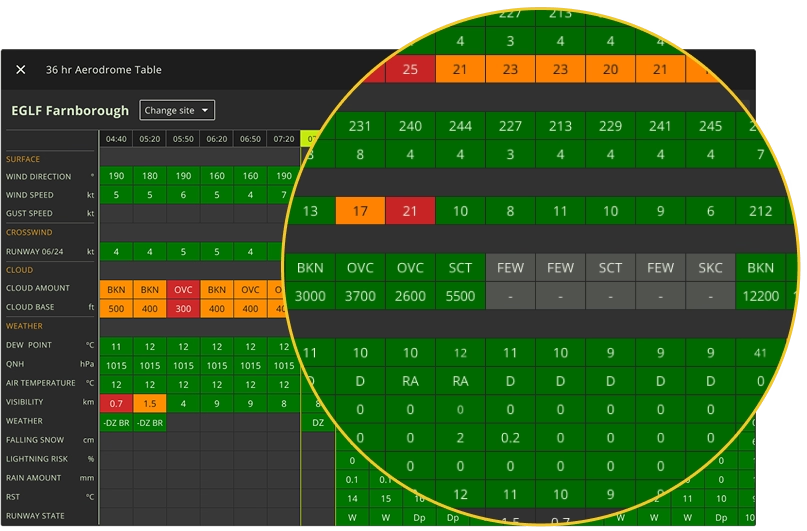
If a RAG status cannot be determined, the table will display data in the relevant cells with a GREY background.
Wind Direction RAG statuses
The wind direction threshold will be triggered in the following scenario.
If the wind direction is between the two values set in the threshold, the colour of the wind direction cell in the 36hr forecast summary table will be determined by the worst of either wind speed, or wind gust.
These rules apply for surface wind direction with the corresponding surface speed and gust thresholds.
For upper winds, the corresponding upper speed should be used (given the table does not display upper wind gusts).
Cloud amount / cloud base RAG statuses
The cloud threshold calculation is based on a combination of cloud amount (measured in oktas), and cloud base (measured in feet).
The cloud height/base threshold specified by a user will only be triggered if the cloud amount for that time period is also >= 5 oktas.
Default threshold values
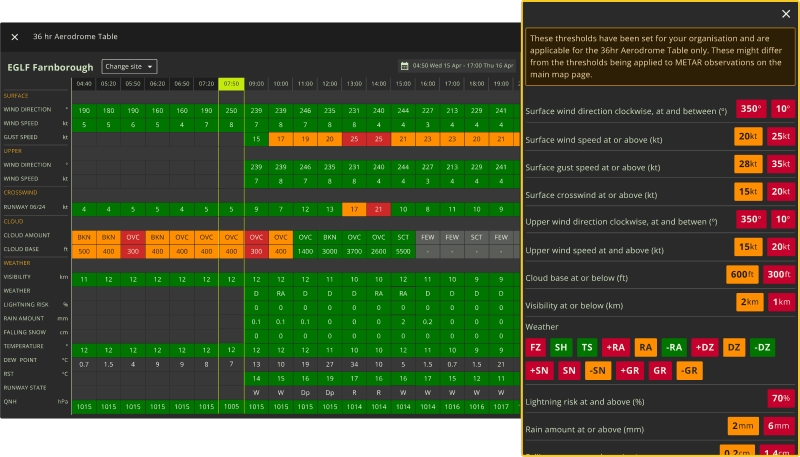
To view the threshold values being applied to each parameter for your organisation, users can click on the ‘VIEW THRESHOLD’ button, which is positioned above the table, to the right, and a panel will open.